

The performance of the stock market determines 70% – 80% of the performance of your self-directed retirement account.
Success at managing your investments is mostly about aligning your portfolio with the trend of the markets and just a little bit about fund choices or selection of individual investments.
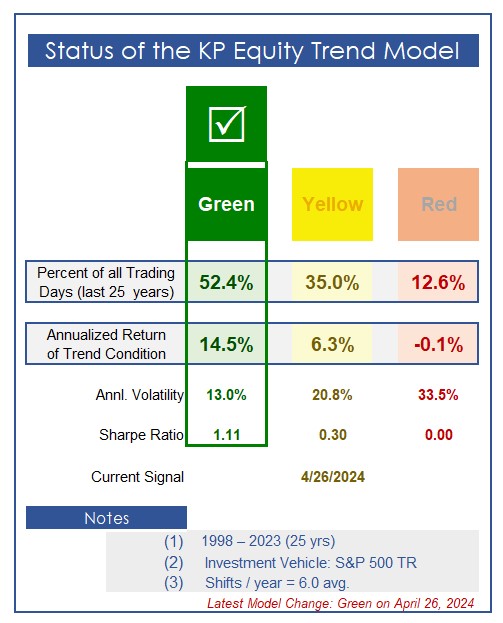
The KP Trend Model adds value primarily by reducing volatility and portfolio drawdown. Our model also enhances returns a bit over time, but its primary mission is to reduce volatility and drawdown. The priorities are Protection and Performance — in that order.
The KP Trend Model generates about six shifts of market exposure a year. Thus, a self-directed 401(k) investor will need to make allocation changes every two months or so. That’s the average — there have been times when the Model has remained unchanged for over nine months, and other times when there were as many as three adjustments in one month! Keeping up with the current status of the Model on this website weekly is important.
Managing your 401(k) successfully is a long-term statistical process based on a mathematical process that has worked exceptionally well over the last 25 years. Still, even a well-designed model makes occasional mistakes, but it’s also designed to recover from them. Individual investors play a key role in their own success when they follow these signals in a disciplined manner.
Keller Partners makes every effort to update this page the day after any signal change. The historical perspectives below assume that any required transactions/adjustments were similarly implemented effective the close of the trading day following the signal.
NOTES —
The KP Equity Trend Model is structured with two components:
(1) An Intermediate-Term Model, based on internal (non-price) market data that shifts directions roughly 5.3 times a year. This model was introduced in January 2005, and has generated daily signals since then.
(2) A Long-Term Model, based on price information (only) that shifts directions less than once a year (0.7 times). The Long-Term component was developed and added to our process in November, 2011.
Both models have been historically evaluated ex post to December 31, 1998 using historical daily market information, some of which is proprietary to our firm. The formula parameters of the models have been applied consistently over these 25 years and are the same ones we use today.
Up-to-date charts of the Trend Model and its two components can be found on the Multi-Media Bar on the home page of this website.
